A Look Back at 2025
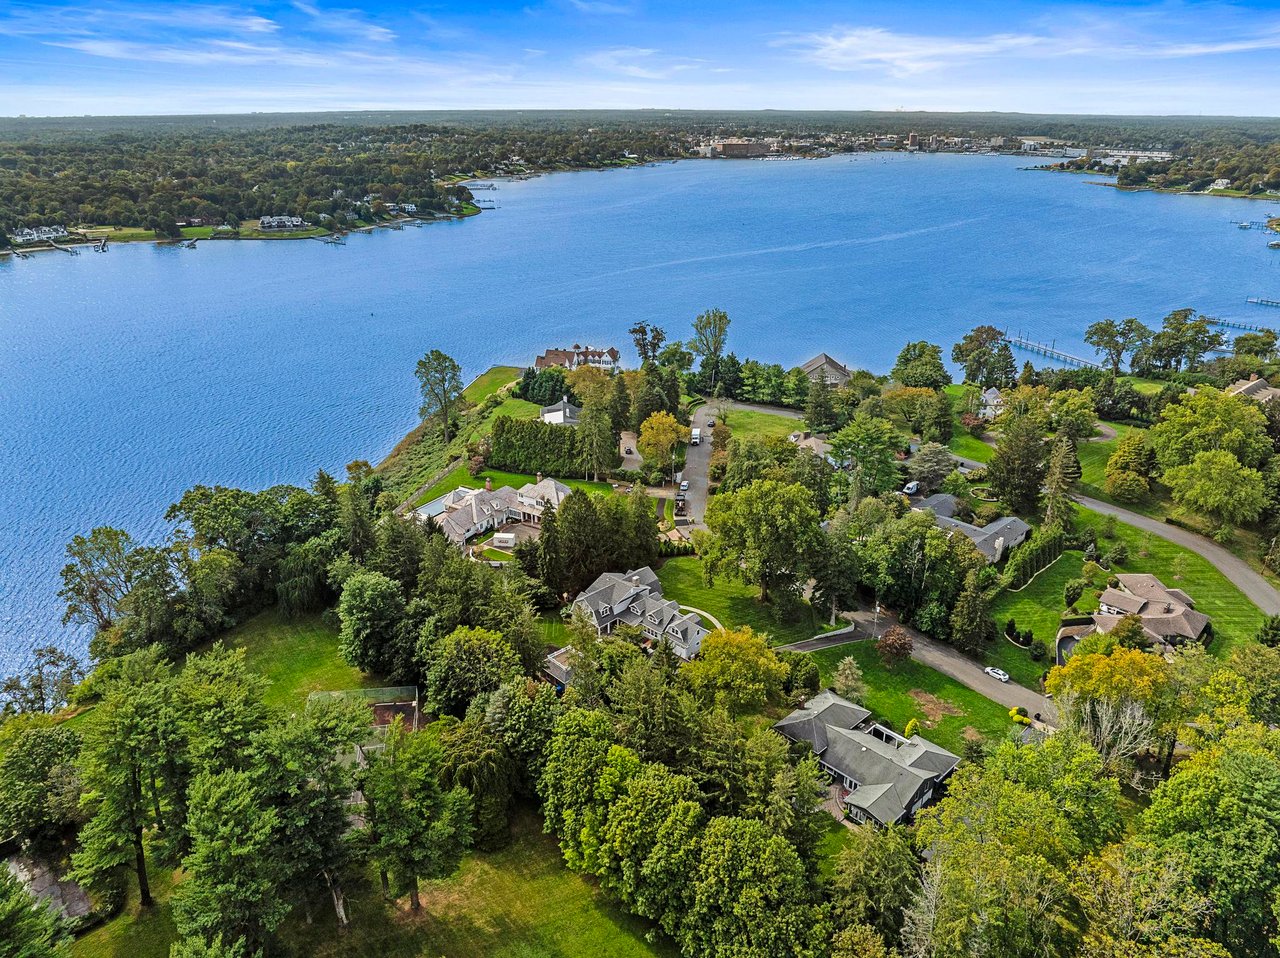
Happy New Year! As I wrapped up the 2025 numbers for our local Monmouth County market, one thing became immediately clear: the story wasn’t the same from town to town. Inventory tightened across most areas, buyers often had fewer choices, and prices generally held steady, even where sales activity slowed. It was a year that reinforced just how hyperlocal real estate truly is.
That unevenness showed up most clearly in Rumson. Despite having 13 fewer homes on the market, the town recorded 22 more sales year over year. Average sale prices rose by roughly 10%, and total dollar volume increased by more than 40%.
Other towns also showed strength - Atlantic Highlands, Highlands, Little Silver, Middletown, and Shrewsbury all posted double-digit increases in average sale prices. Sea Bright experienced a decline in the number of homes sold, though average prices remained stable. Red Bank followed a different pattern, with 15% fewer homes selling than were listed and a 6% decline in average sale price. Fair Haven remained relatively flat, with slightly more homes selling year over year and a slight dip in prices.
Taken together, the 2025 data reinforces a clear theme: outcomes were driven less by volume and more by which homes sold and where.
What This Means Heading Into 2026
For sellers, the data is encouraging, but also instructive. Buyers are still active and willing to pay for well-positioned homes, yet they remain selective and informed.
For buyers, the numbers validate what many experienced firsthand: competition exists, but it is measured. Preparation, local knowledge, and timing continue to play a meaningful role.
And for those simply watching the market, 2025 reinforced a familiar truth: real estate is intensely local. Results depend far less on national headlines and far more on what’s happening on a specific street, in a specific town, at a specific moment.
If you’re thinking about making a move in 2026 or simply want to understand how these trends relate to your home and your neighborhood, I’m always happy to walk through the numbers with you. A quick, town-specific conversation can often reveal more than broad market headlines.
| Municipality | 2024 | 2025 | % Change | 2024 | 2025 | % Change | * % Delta 24' v 25' |
| Atlantic Highlands | 98 | 98 | 0 | 64 | 50 | -21 | -21 |
| Fair Haven | 106 | 94 | -11 | 78 | 72 | -7 | 4 |
| Highlands | 135 | 142 | 5 | 92 | 86 | -6 | -11 |
| Little Silver | 93 | 82 | -11 | 72 | 63 | -12 | -1 |
| Long Branch | 576 | 581 | 0 | 222 | 231 | 4 | 4 |
| Middletown | 922 | 927 | 0 | 695 | 714 | 2 | 2 |
| Monmouth Beach | 112 | 109 | -2 | 66 | 73 | 10 | 12 |
| Oceanport | 118 | 76 | -35 | 77 | 64 | -16 | 19 |
| Red Bank | 179 | 208 | 16 | 145 | 147 | 1 | -15 |
| Rumson | 158 | 142 | -10 | 80 | 102 | 27 | 37 |
| Sea Bright | 76 | 60 | -21 | 49 | 26 | -46 | -25 |
| Shrewsbury Boro | 55 | 49 | -10 | 40 | 41 | 2 | 12 |
| * positive % means stronger market- more sales than listings / negative % means weaker market - more listings than sales in 2025 | |||||||
| SOLD VOLUME | AVERAGE SALE PRICE | % OF LIST | |||||||
| Municipality | 2024 | 2025 | % Change | 2024 | 2025 | % Change | 2024 | 2025 | % Change |
| Atlantic Highlands | 48,872,999 | 52,755,340 | 7 | 460,076 | 1,055,106 | 38 | 97 | 103 | 6 |
| Fair Haven | 118,713,014 | 106,002,212 | -10 | 1,521,961 | 1,472,252 | -3 | 101 | 103 | 1 |
| Highlands | 53,186,766 | 54,782,231 | 2 | 578,117 | 637,002 | 10 | 100 | 99 | -1 |
| Little Silver | 79,438,683 | 77,467,546 | -2 | 1,103,315 | 1,229,643 | 11 | 100 | 103 | 3 |
| Long Branch | 202,139,036 | 230,519,923 | 14 | 910,536 | 997,921 | 9 | 95 | 95 | 0 |
| Middletown | 516,512,150 | 595,338,341 | 15 | 743,182 | 833,807 | 12 | 102 | 102 | 0 |
| Monmouth Beach | 79,318,200 | 95,427,999 | 20 | 1,201,790 | 1,307,232 | 8 | 96 | 94 | -2 |
| Oceanport | 79,006,162 | 68,334,335 | -13 | 1,026,054 | 1,067,723 | 4 | 98 | 100 | 2 |
| Red Bank | 104,673,604 | 99,349,311 | -5 | 721,886 | 675,845 | -6 | 99 | 100 | 1 |
| Rumson | 195,660,579 | 275,986,625 | 41 | 2,445,757 | 2,705,751 | 10 | 99 | 97 | -2 |
| Sea Bright | 72,734,889 | 38,116,900 | -47 | 1,484,385 | 1,466,034 | -1 | 96 | 94 | -2 |
| Shrewsbury Boro | 36,725,154 | 46,684,777 | 27 | 918,128 | 1,138,653 | 24 | 101 | 101 | 0 |
 |